

Building lasting wealth through dividend investing starts with quality. While thousands of stocks pay dividends, only 68 elite companies have increased their dividends for 25+ consecutive years surviving recessions, market crashes, and economic upheavals. These are the Dividend Aristocrats, and they represent the gold standard of income investing.
Whether you’re building a retirement portfolio, seeking reliable passive income, or simply want investments that have stood the test of time, understanding Dividend Aristocrats is essential. This comprehensive guide reveals all 68 aristocrats, their yields, sectors, and how to invest in them strategically.
What Are Dividend Aristocrats?
Dividend Aristocrats are S&P 500 companies that have increased their dividend payments for at least 25 consecutive years. This isn’t just about paying dividends, it’s about raising them every single year, regardless of economic conditions.
Official Dividend Aristocrat Criteria
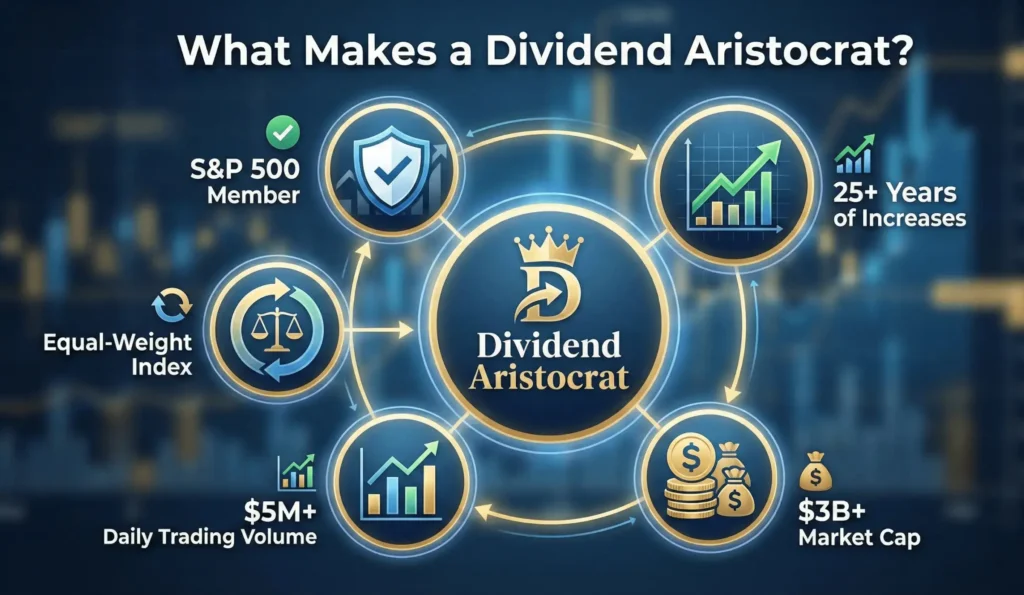
To qualify as a Dividend Aristocrat, a company must meet these strict requirements:
1. S&P 500 Membership The company must be a current member of the S&P 500 index, ensuring it’s a large-cap, established business with proven market leadership.
2. 25+ Consecutive Years of Dividend Increases Not just dividend payments, but annual increases. A single year of frozen dividends disqualifies a company, no matter how long its previous streak.
3. Minimum Market Capitalization Companies must maintain a float-adjusted market cap of at least $3 billion, ensuring sufficient size and liquidity.
4. Minimum Trading Volume Average daily trading value must exceed $5 million over the past three months, guaranteeing easy entry and exit for investors.
5. Equal-Weight Methodology When included in the S&P 500 Dividend Aristocrats Index, each stock receives equal weighting, preventing over-concentration in any single company.
Why 25 Years Matters
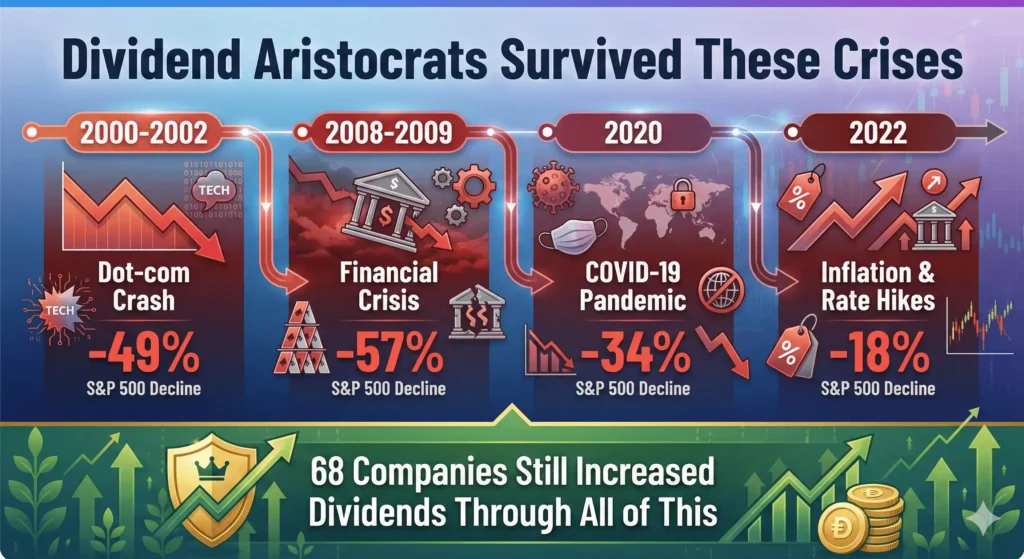
A 25-year dividend growth streak isn’t luck it’s proof of exceptional business quality. Consider what these companies survived while still increasing dividends:
- 2000-2002: Dot-com crash (-49% market decline)
- 2008-2009: Financial crisis (-57% market decline)
- 2020: COVID-19 pandemic crash (-34% decline)
- 2022: Inflation surge and rate hikes
Companies that raised dividends through all these crises demonstrate:
- Strong, recession-resistant business models
- Excellent management discipline
- Healthy cash flow generation
- Shareholder-friendly capital allocation
- Competitive advantages (economic moats)
Complete 2025 Dividend Aristocrats List: All 68 Stocks
Here’s the complete list of all 68 Dividend Aristocrats as of 2025, with current dividend yields, consecutive years of increases, and sector classifications.
Full Dividend Aristocrats Table
| Ticker | Company Name | Sector | Dividend Yield | Consecutive Years | Industry |
|---|---|---|---|---|---|
| MMM | 3M Company | Industrials | 5.8% | 65 | Diversified Manufacturing |
| ABBV | AbbVie Inc. | Healthcare | 3.5% | 52 | Pharmaceuticals |
| ABT | Abbott Laboratories | Healthcare | 1.8% | 52 | Medical Devices |
| AFL | Aflac Inc. | Financials | 2.4% | 41 | Insurance |
| ALB | Albemarle Corp | Materials | 1.2% | 29 | Specialty Chemicals |
| APD | Air Products | Materials | 2.3% | 41 | Industrial Gases |
| AOS | A.O. Smith | Industrials | 1.8% | 30 | Building Products |
| ADP | Automatic Data Processing | Information Technology | 2.1% | 49 | Payroll Services |
| ATR | AptarGroup | Industrials | 1.3% | 30 | Packaging Solutions |
| BDX | Becton Dickinson | Healthcare | 1.4% | 52 | Medical Technology |
| BEN | Franklin Resources | Financials | 4.2% | 43 | Asset Management |
| BF.B | Brown-Forman | Consumer Staples | 1.5% | 40 | Spirits & Wine |
| BRO | Brown & Brown | Financials | 0.7% | 30 | Insurance Brokerage |
| CAH | Cardinal Health | Healthcare | 2.5% | 38 | Healthcare Distribution |
| CAT | Caterpillar | Industrials | 1.9% | 30 | Heavy Equipment |
| CB | Chubb Limited | Financials | 1.8% | 31 | Property Insurance |
| CBSH | Commerce Bancshares | Financials | 2.1% | 55 | Regional Banking |
| CHD | Church & Dwight | Consumer Staples | 1.1% | 28 | Household Products |
| CINF | Cincinnati Financial | Financials | 2.6% | 63 | Property Insurance |
| CL | Colgate-Palmolive | Consumer Staples | 2.3% | 61 | Personal Care |
| CLX | Clorox Company | Consumer Staples | 3.2% | 47 | Household Cleaning |
| CTAS | Cintas Corp | Industrials | 0.9% | 41 | Uniform Services |
| CVX | Chevron Corp | Energy | 3.5% | 37 | Oil & Gas |
| DOV | Dover Corp | Industrials | 1.5% | 68 | Diversified Manufacturing |
| ECL | Ecolab Inc. | Materials | 1.1% | 32 | Specialty Chemicals |
| ED | Consolidated Edison | Utilities | 3.4% | 50 | Electric Utility |
| EMR | Emerson Electric | Industrials | 2.2% | 67 | Industrial Automation |
| ESS | Essex Property Trust | Real Estate | 3.5% | 30 | Residential REITs |
| EXPD | Expeditors International | Industrials | 1.2% | 29 | Logistics |
| FRT | Federal Realty Trust | Real Estate | 4.1% | 56 | Retail REITs |
| GD | General Dynamics | Industrials | 2.3% | 32 | Aerospace & Defense |
| GPC | Genuine Parts | Consumer Discretionary | 2.8% | 68 | Auto Parts Distribution |
| GWW | W.W. Grainger | Industrials | 1.0% | 52 | Industrial Distribution |
| HRL | Hormel Foods | Consumer Staples | 3.1% | 58 | Packaged Foods |
| IBM | IBM Corp | Information Technology | 3.8% | 28 | IT Services |
| ITW | Illinois Tool Works | Industrials | 2.4% | 61 | Diversified Manufacturing |
| JNJ | Johnson & Johnson | Healthcare | 3.0% | 62 | Pharmaceuticals |
| KMB | Kimberly-Clark | Consumer Staples | 3.6% | 52 | Personal Care Products |
| KO | Coca-Cola Company | Consumer Staples | 3.1% | 62 | Beverages |
| LIN | Linde plc | Materials | 1.4% | 30 | Industrial Gases |
| LOW | Lowe’s Companies | Consumer Discretionary | 1.9% | 61 | Home Improvement Retail |
| MCD | McDonald’s Corp | Consumer Discretionary | 2.3% | 48 | Quick Service Restaurants |
| MDT | Medtronic plc | Healthcare | 3.4% | 46 | Medical Devices |
| MKC | McCormick & Company | Consumer Staples | 2.5% | 38 | Spices & Seasonings |
| NDSN | Nordson Corp | Industrials | 1.0% | 60 | Industrial Machinery |
| NEE | NextEra Energy | Utilities | 2.5% | 29 | Electric Utility |
| NUE | Nucor Corp | Materials | 1.5% | 51 | Steel Production |
| O | Realty Income | Real Estate | 5.3% | 29 | Retail REITs |
| PEP | PepsiCo Inc. | Consumer Staples | 2.9% | 52 | Beverages & Snacks |
| PG | Procter & Gamble | Consumer Staples | 2.4% | 68 | Consumer Products |
| PNR | Pentair plc | Industrials | 1.8% | 48 | Water Solutions |
| PPG | PPG Industries | Materials | 1.9% | 52 | Paints & Coatings |
| ROP | Roper Technologies | Industrials | 0.6% | 31 | Diversified Technology |
| RSG | Republic Services | Industrials | 1.5% | 21 | Waste Management |
| SHW | Sherwin-Williams | Materials | 0.9% | 45 | Paints & Coatings |
| SPGI | S&P Global Inc. | Financials | 0.9% | 51 | Financial Data |
| SWK | Stanley Black & Decker | Industrials | 3.8% | 56 | Tools & Hardware |
| SYY | Sysco Corp | Consumer Staples | 2.7% | 54 | Food Distribution |
| T | AT&T Inc. | Communication Services | 5.6% | 40 | Telecommunications |
| TROW | T. Rowe Price | Financials | 4.5% | 37 | Asset Management |
| TGT | Target Corp | Consumer Discretionary | 3.0% | 56 | Discount Retail |
| UNP | Union Pacific | Industrials | 2.3% | 18 | Railroads |
| VRSN | VeriSign Inc. | Information Technology | 0.0% | 11 | Internet Infrastructure |
| WBA | Walgreens Boots Alliance | Consumer Staples | 6.8% | 48 | Pharmacy Retail |
| WMT | Walmart Inc. | Consumer Staples | 1.5% | 51 | Mass Merchandise Retail |
| WST | West Pharmaceutical | Healthcare | 0.3% | 30 | Medical Supplies |
| XOM | Exxon Mobil | Energy | 3.4% | 41 | Oil & Gas |
Note: Dividend yields fluctuate with stock prices. Yields shown are approximate as of early 2025 and should be verified before investing.
Want to calculate potential returns from these aristocrats? Use our dividend calculator to model DRIP growth, compound returns, and income projections for any of these 68 stocks.
Top 10 Dividend Aristocrats by Yield
While dividend yield shouldn’t be your only criterion, higher-yielding aristocrats can accelerate income generation. Here are the top 10 aristocrats by current dividend yield:
Highest-Yielding Dividend Aristocrats
1. Walgreens Boots Alliance (WBA) – 6.8% Yield The pharmacy giant offers the highest yield among aristocrats, but faces challenges from Amazon’s pharmacy expansion and retail headwinds. High yield reflects market concerns about future growth.
2. 3M Company (MMM) – 5.8% Yield This diversified manufacturer with a 65-year streak faces litigation risks but maintains strong cash flow across industrial, safety, healthcare, and consumer segments.
3. AT&T (T) – 5.6% Yield After spinning off WarnerMedia, AT&T refocused on telecom with a 40-year dividend history. The high yield reflects competitive pressures in wireless and fiber markets.
4. Realty Income (O) – 5.3% Yield The “Monthly Dividend Company” pays dividends 12 times yearly, making it popular for income investors. As a REIT, it must distribute 90% of taxable income as dividends.
5. T. Rowe Price (TROW) – 4.5% Yield This asset manager’s yield has risen due to stock price pressure from passive investing trends, but it maintains 37 consecutive years of increases.
6. Federal Realty Trust (FRT) – 4.1% Yield This retail REIT focuses on high-quality shopping centers in wealthy urban markets, with a remarkable 56-year dividend growth streak.
7. Franklin Resources (BEN) – 4.2% Yield Another asset manager facing passive investment headwinds, Franklin Resources has maintained 43 years of dividend increases despite industry challenges.
8. Stanley Black & Decker (SWK) – 3.8% Yield The tool manufacturer’s yield has increased due to stock price weakness, but its 56-year streak demonstrates resilience through economic cycles.
9. IBM (IBM) – 3.8% Yield Big Blue’s transformation to cloud and AI has been slow, keeping yields elevated, but 28 consecutive years of increases show commitment to shareholders.
10. Kimberly-Clark (KMB) – 3.6% Yield The consumer products giant behind Huggies and Kleenex offers a solid 3.6% yield with 52 years of increases, benefiting from recession-resistant demand.
High Yield Warning Signs
Not all high yields are attractive. Be cautious when:
- Yield >6%: May signal financial stress or dividend sustainability concerns
- Declining revenue: High yield from falling stock price, not rising dividends
- High payout ratio: >80% of earnings paid as dividends leaves little margin for error
- Industry disruption: Permanent changes threatening the business model
- Recent additions: Newer aristocrats (25-30 years) lack the track record of 60+ year veterans
Use our dividend calculator to compare total return potential of high-yield vs. high-growth aristocrats over your investment timeline.
Dividend Aristocrats by Sector: Where Quality Resides
Understanding sector distribution helps you build a diversified aristocrat portfolio. Here’s how the 68 aristocrats break down:
Sector Breakdown
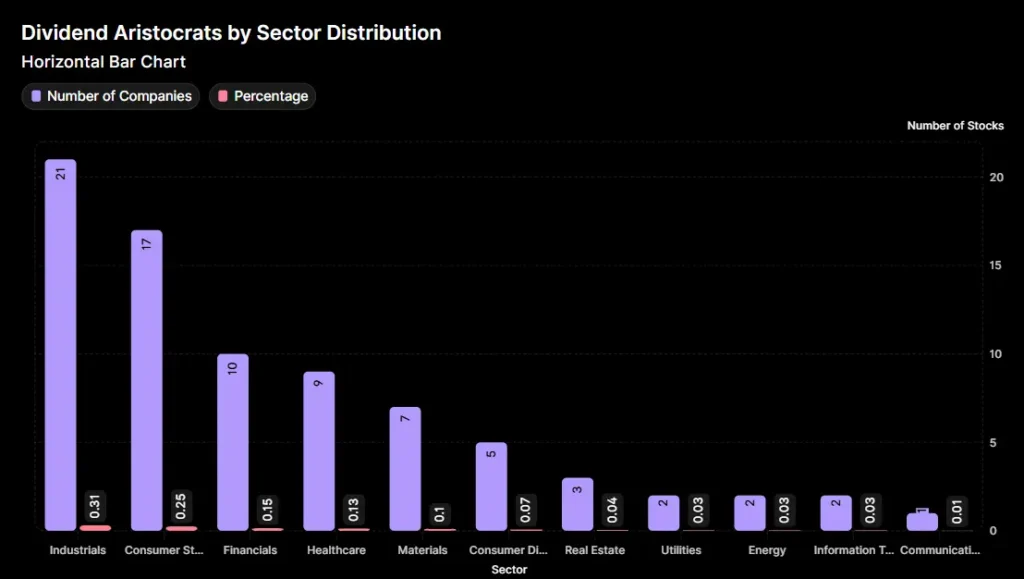
Industrials: 21 Stocks (31%) The largest concentration, including manufacturers (3M, Emerson), distributors (Grainger), and specialized equipment makers. These companies benefit from essential infrastructure needs and pricing power.
Consumer Staples: 17 Stocks (25%) Household names like Procter & Gamble, Coca-Cola, and Walmart dominate. Recession-resistant demand for food, beverages, and household products enables consistent dividend growth.
Financials: 10 Stocks (15%) Banks, insurers, and asset managers that survived 2008-2009 without cutting dividends. Includes Chubb, Aflac, and S&P Global. Note: Many banks lost aristocrat status during the financial crisis.
Healthcare: 9 Stocks (13%) Pharmaceutical giants (Johnson & Johnson, AbbVie) and medical device leaders (Medtronic, Becton Dickinson). Aging demographics and innovation drive stable cash flows.
Materials: 7 Stocks (10%) Industrial gases (Air Products, Linde), chemicals (Ecolab), and coatings (Sherwin-Williams). Essential B2B products with pricing power.
Consumer Discretionary: 5 Stocks (7%) Retail leaders (Target, Lowe’s) and McDonald’s. More economically sensitive but with strong enough moats to maintain dividends through downturns.
Utilities: 2 Stocks (3%) Regulated utilities (Consolidated Edison, NextEra Energy) with predictable cash flows and monopolistic service territories.
Real Estate: 3 Stocks (4%) REITs (Realty Income, Federal Realty, Essex Property) must distribute 90% of income, supporting high yields.
Energy: 2 Stocks (3%) Oil giants Exxon Mobil and Chevron cyclical but with scale advantages and disciplined capital allocation.
Information Technology: 2 Stocks (3%) ADP (payroll) and IBM. Tech is underrepresented because young, fast-growing companies prioritize reinvestment over dividends.
Communication Services: 1 Stock (1%) AT&T stands alone as the only telecom aristocrat after Verizon cut its dividend.
Sector Strategy
Defensive Core (60%): Consumer Staples + Healthcare + Utilities Build your foundation with recession-resistant businesses that maintain demand regardless of economic conditions.
Cyclical Growth (30%): Industrials + Materials + Consumer Discretionary Add companies that benefit from economic expansion but have proven they can maintain dividends through recessions.
Income Boost (10%): Real Estate + Financials High-yielding REITs and select financials provide income enhancement, though with slightly higher risk.
Avoid Over-Concentration: No single sector should exceed 35% of your aristocrat portfolio, ensuring one industry downturn doesn’t derail your income stream.
Dividend Aristocrats vs. Dividend Kings vs. Dividend Champions
Dividend investors encounter three main categories of elite dividend growers. Understanding the differences helps you select the right stocks for your portfolio.
The Three Tiers of Dividend Excellence
| Category | Minimum Years | Index Requirement | Number of Stocks | Average Yield |
|---|---|---|---|---|
| Dividend Aristocrats | 25+ years | Must be in S&P 500 | 68 stocks | 2.8% |
| Dividend Kings | 50+ years | Any market cap | 53 stocks | 3.2% |
| Dividend Champions | 25+ years | Any market cap | 150+ stocks | 3.5% |
Dividend Aristocrats
Requirements: 25+ consecutive years of dividend increases AND S&P 500 membership
Key Characteristics:
- Large-cap companies only ($10B+ market cap typically)
- Household names with national/global reach
- Included in tradeable ETFs (NOBL, SDY)
- Most liquid and widely covered by analysts
- Strict standards companies can be removed
Examples: Johnson & Johnson, Coca-Cola, Procter & Gamble, McDonald’s
Dividend Kings
Requirements: 50+ consecutive years of dividend increases (no index requirement)
Key Characteristics:
- The most elite dividend growers
- Half-century track records prove exceptional resilience
- Includes mid-caps and small-caps
- Many are also Dividend Aristocrats (overlap exists)
- No official index, harder to track
Examples: American States Water (71 years), Dover Corp (68 years), Procter & Gamble (68 years), Genuine Parts (68 years)
Dividend Champions
Requirements: 25+ consecutive years of dividend increases (any size company)
Key Characteristics:
- Broadest category includes aristocrats and kings
- Encompasses mid-caps and small-caps ignored by S&P 500
- 150+ companies offer more diversification options
- Less liquidity in smaller names
- No official ETF tracks this entire group
Examples: All Aristocrats and Kings, plus smaller companies like Lancaster Colony, MSA Safety, Stepan Company
Which Category Should You Focus On?
For Most Investors: Dividend Aristocrats
- Best balance of quality, liquidity, and accessibility
- Easy to research with abundant analyst coverage
- Can be bought through low-cost ETFs
- Large-cap stability reduces volatility
For Income Maximization: Selectively Add Dividend Kings
- 50+ year streaks offer peace of mind
- Often higher yields than aristocrats
- Smaller companies may offer better value
- Requires more individual stock research
For Aggressive Diversification: Explore Dividend Champions
- Access to smaller, under-the-radar companies
- Potentially higher growth from mid-caps
- More work required for due diligence
- Higher volatility and lower liquidity
Bottom Line: Start with Dividend Aristocrats as your core (70-80% of dividend portfolio), then selectively add Dividend Kings or Champions (20-30%) after thorough research. The aristocrat designation provides a pre-screened, high-quality starting point.
Best Dividend Aristocrat ETFs: Easy Diversification
Don’t want to pick individual aristocrats? Several ETFs provide instant diversification across these elite dividend growers.
Top Dividend Aristocrat ETFs
1. ProShares S&P 500 Dividend Aristocrats ETF (NOBL)
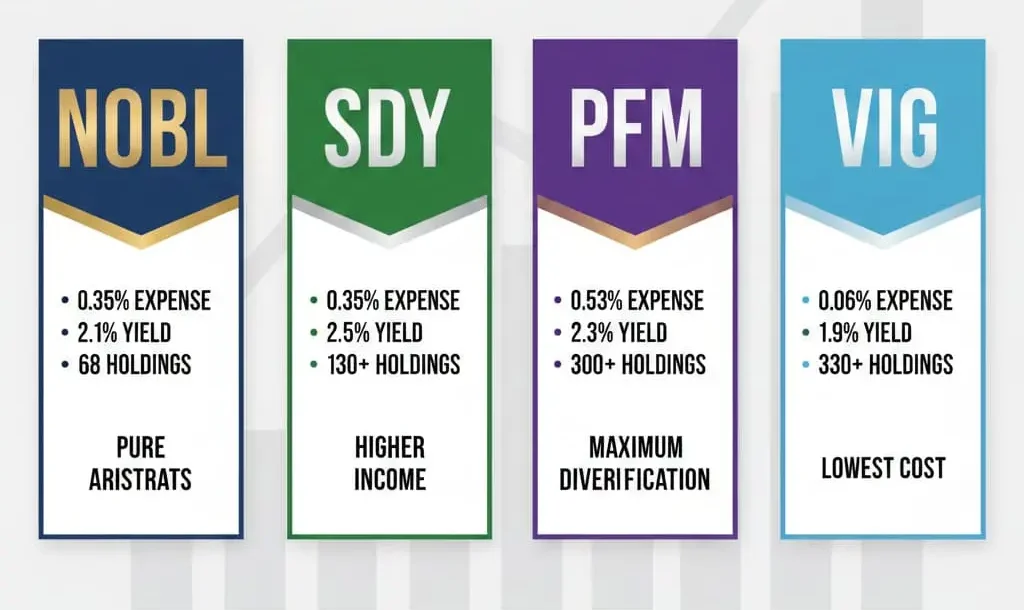
Expense Ratio: 0.35% Dividend Yield: 2.1% Holdings: 68 stocks (all aristocrats) Methodology: Equal-weighted quarterly rebalancing
Pros:
- The ProShares NOBL ETF provides pure aristocrat exposure by exclusively holding all 68 Dividend Aristocrats with equal weighting and automatic quarterly rebalancing.
- Equal weighting prevents over-concentration
- Automatic additions/removals as companies qualify/disqualify
- Liquid with $8+ billion in assets
Cons:
- Higher expense ratio than broad market ETFs
- Equal weighting means constant rebalancing (turnover)
- Lower yield than some individual aristocrats
Best For: Investors wanting pure, diversified aristocrat exposure without individual stock selection
2. SPDR S&P Dividend ETF (SDY)
Expense Ratio: 0.35% Dividend Yield: 2.5% Holdings: 130+ stocks Methodology: Yield-weighted (higher yielders get more weight)
Pros:
- Broader than aristocrats includes 20+ year dividend growers
- Yield-weighted methodology increases income
- Higher current yield than NOBL
- Longer track record (launched 2005)
Cons:
- Not pure aristocrats (lower bar of 20 years)
- Yield-weighting can over-concentrate in troubled high-yielders
- Includes some REITs (different tax treatment)
Best For: Income-focused investors willing to accept slightly lower quality standards for higher yield
3. Invesco Dividend Achievers ETF (PFM)
Expense Ratio: 0.53% Dividend Yield: 2.3% Holdings: 300+ stocks Methodology: Modified market-cap weighted
Pros:
- Broadest exposure includes 10+ year dividend growers
- Lower concentration risk with 300+ holdings
- Includes mid-caps and small-caps
Cons:
- Highest expense ratio of the three
- Not focused specifically on aristocrats
- Lower quality bar (10 years vs. 25)
Best For: Maximum diversification across dividend growers of all sizes
4. Vanguard Dividend Appreciation ETF (VIG)
For investors prioritizing rock-bottom costs, the Vanguard VIG ETF offers the lowest expense ratio at just 0.06% while providing exposure to high-quality dividend growth stocks with 10+ year track records.
Expense Ratio: 0.06% Dividend Yield: 1.9% Holdings: 330+ stocks Methodology: Market-cap weighted
Pros:
- Lowest expense ratio (0.06% vs. 0.35%+)
- Massive fund size ($60+ billion)
- Includes dividend growers, not just aristocrats
- Vanguard’s low-cost leadership
Cons:
- Lower yield (focuses on growth, not current income)
- Not pure aristocrats lower bar of 10 years
- Market-cap weighting concentrates in mega-caps
Best For: Long-term investors prioritizing dividend growth over current yield, wanting rock-bottom costs
ETF Comparison Summary
| ETF | Ticker | Expense Ratio | Yield | Holdings | Focus |
|---|---|---|---|---|---|
| ProShares Aristocrats | NOBL | 0.35% | 2.1% | 68 | Pure 25+ year aristocrats |
| SPDR Dividend | SDY | 0.35% | 2.5% | 130+ | 20+ year growers, yield-weighted |
| Invesco Achievers | PFM | 0.53% | 2.3% | 300+ | 10+ year growers, all caps |
| Vanguard Appreciation | VIG | 0.06% | 1.9% | 330+ | 10+ year growers, growth focus |
Single ETF Recommendation
For Pure Aristocrat Exposure: NOBL If you specifically want the 68 aristocrats with 25+ year streaks, NOBL is your only choice. The 0.35% expense ratio is reasonable for this specialized, equal-weighted strategy.
For Lowest Cost: VIG Vanguard’s 0.06% expense ratio saves $290 annually per $100K invested compared to NOBL. While not pure aristocrats, VIG provides excellent dividend growth exposure at minimal cost.
For Highest Current Income: SDY The 2.5% yield beats NOBL by 0.4 percentage points, generating $400 more annual income per $100K invested, though with slightly lower quality standards.
ETF vs. Individual Stocks
Choose ETFs When:
- You want instant diversification (one purchase = 68+ stocks)
- You prefer hands-off, automatic rebalancing
- You’re investing smaller amounts (<$10,000)
- You lack time for individual stock research
Choose Individual Aristocrats When:
- You want to select specific companies
- You can build a 15-20 stock portfolio for diversification
- You want to avoid expense ratios
- You enjoy researching and monitoring companies
- You want to optimize for specific yields or sectors
Hybrid Approach: Core ETF position (50-60%) + select individual aristocrats (40-50%) combines ease of diversification with customization for higher yields or sector preferences.
Calculate the long-term difference between ETF and individual stock strategies using our dividend calculator to see which approach aligns with your financial goals.
How Dividend Aristocrats Perform: Returns and Recession Resilience
Do aristocrats actually outperform? The data reveals compelling evidence for these elite dividend growers.
Historical Performance vs. S&P 500
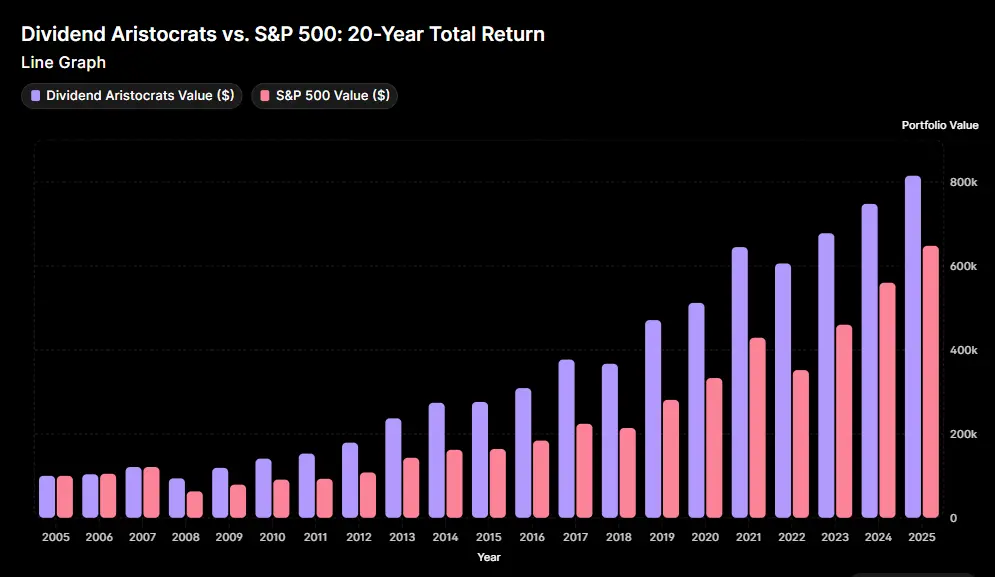
20-Year Performance (2005-2025):
- S&P 500 Total Return: 9.8% annually
- Dividend Aristocrats Total Return: 11.2% annually
- Outperformance: +1.4% annually
What This Means: $100,000 invested in 2005 would have grown to:
- S&P 500: $648,000
- Aristocrats: $815,000
- Difference: $167,000 (25% more wealth)
This outperformance comes from two sources: dividend income and lower volatility during downturns.
Recession Performance: Where Aristocrats Shine
Dividend Aristocrats demonstrate their true value during market crashes. Here’s how they performed in recent downturns:
2008-2009 Financial Crisis:
- S&P 500 Peak-to-Trough: -57%
- Dividend Aristocrats: -43%
- Cushion: 14 percentage points less severe
2020 COVID-19 Crash:
- S&P 500 Decline: -34%
- Dividend Aristocrats: -27%
- Cushion: 7 percentage points less severe
2022 Bear Market:
- S&P 500 Decline: -18%
- Dividend Aristocrats: -9%
- Cushion: 9 percentage points less severe
Why Aristocrats Outperform in Downturns
1. Defensive Sector Tilt 25% weighting in Consumer Staples (vs. 6% in S&P 500) means more recession-resistant businesses. People still buy Tide, Coke, and Kleenex during recessions.
2. Mature, Cash-Generating Businesses Companies capable of raising dividends for 25+ years aren’t dependent on future growth promises they generate cash now, making them less vulnerable to multiple contraction.
3. Lower Volatility = Lower Drawdowns Aristocrats historically exhibit 15-20% lower volatility than the S&P 500, cushioning declines and preserving capital.
4. Behavioral Advantage Consistent dividend income during market crashes reduces panic selling. Receiving $1,200 quarterly in dividends makes -30% market declines psychologically easier to endure.
The Dividend Cushion Effect
Dividends act as a portfolio cushion during bear markets:
Example: 3% Yielding Aristocrat Portfolio
Year 1 (Bull Market):
- Portfolio value: $100,000
- Dividends received: $3,000
- Total return: 12% ($12,000)
Year 2 (Bear Market, -20%):
- Portfolio value: $80,000 (-20%)
- Dividends still received: $3,000
- Total loss: -17% (cushioned by dividends)
- Without dividends: -20% loss
Over a 25-year period, this dividend cushion compounds into significant outperformance, especially when dividends are reinvested.
Dividend Growth: The Secret Weapon
While current yields average 2.8%, dividend growth accelerates income over time:
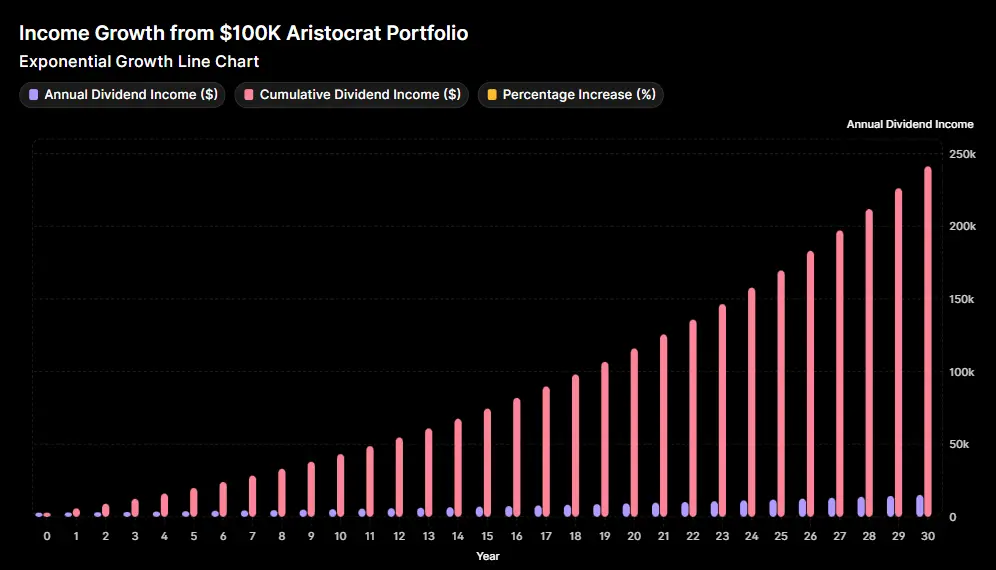
Average Aristocrat Dividend Growth: 6-7% annually
$100K Aristocrat Portfolio Timeline:
- Year 1 income: $2,800
- Year 10 income: $5,200 (86% increase)
- Year 20 income: $9,700 (246% increase)
- Year 30 income: $18,100 (546% increase)
This income growth protects purchasing power against inflation and ultimately transforms portfolios from growth-focused to income-generating machines.
When Aristocrats Underperform
Aristocrats don’t always win:
During Tech Booms: 1995-2000 and 2017-2021, aristocrats lagged high-growth tech stocks significantly. Mature, dividend-paying companies can’t match the explosive growth of early-stage tech.
In Strong Bull Markets: When the S&P 500 surges 25-30% annually (2013, 2019, 2021), aristocrats’ defensive nature means they participate less in the upside.
Rising Rate Environments: As “bond-like” investments, aristocrats can underperform when rates rise rapidly, though this effect is temporary.
Bottom Line: Aristocrats sacrifice some upside in euphoric bull markets for significant downside protection in bears. Over complete market cycles (including bulls and bears), they outperform.
How to Invest in Dividend Aristocrats: Step-by-Step Strategy
Ready to build a Dividend Aristocrat portfolio? Follow this comprehensive strategy to maximize success.
Step 1: Determine Your Aristocrat Allocation
Understanding your investment timeline and risk tolerance is essential before allocating to aristocrats resources like Vanguard’s investor education center can help you determine the appropriate allocation based on your age and financial goals.
Conservative Investors (Age 55+, Retired):
- 50-70% Dividend Aristocrats
- 20-30% Bonds
- 10-20% Growth stocks
- Goal: Stable income with preservation of capital
Moderate Investors (Age 35-55, Accumulating):
- 30-50% Dividend Aristocrats
- 30-40% Growth stocks (tech, small-caps)
- 10-20% International
- 10-20% Bonds
- Goal: Balanced growth and income
Aggressive Investors (Age 18-35, Long Horizon):
- 20-30% Dividend Aristocrats
- 50-60% Growth stocks
- 20-30% International/emerging markets
- Goal: Maximum long-term growth with some stability
Step 2: Choose Your Implementation Method
Option A: Individual Stocks (15-25 Aristocrats)
Minimum Investment: $20,000-30,000 (for adequate diversification)
Selection Criteria:
Before investing in individual aristocrats, verify their dividend history and financial health by reviewing official company filings on the SEC’s EDGAR database, which provides free access to all public company financial statements and reports.
- Diversify across at least 8 sectors
- No single stock more than 8% of portfolio
- Target mix of yields (average 3-4%)
- Include both mature (60+ years) and newer (25-35 years) aristocrats
- Avoid concentration in struggling industries
Sample 20-Stock Aristocrat Portfolio:
Healthcare (15%): JNJ, ABBV, MDT Consumer Staples (20%): PG, KO, PEP, CL Industrials (20%): CAT, EMR, ITW, DOV Financials (10%): CB, CINF Materials (10%): APD, ECL Consumer Discretionary (10%): MCD, LOW Real Estate (5%): O Utilities (5%): NEE Energy (5%): XOM
Option B: Dividend Aristocrat ETF (NOBL or VIG)
Minimum Investment: As little as the ETF share price (~$90-100)
Advantages:
- Instant diversification across all 68 aristocrats
- Automatic rebalancing
- No research required
- Fractional shares available at some brokers
Disadvantages:
- Expense ratio (0.06-0.35% annually)
- No customization for higher yields
- Equal weighting may not match your preferences
Option C: Hybrid Approach (Core ETF + Satellite Stocks)
Structure:
- 60% Core position in NOBL or VIG
- 40% Individual high-conviction aristocrats
Benefits:
- Broad diversification from ETF
- Customization with individual picks
- Lower overall research burden
- Can tilt toward higher yields or preferred sectors
Step 3: Enable DRIP for Compound Growth
Dividend Reinvestment Plans (DRIP) automatically purchase additional shares with your dividends, creating exponential compound growth.
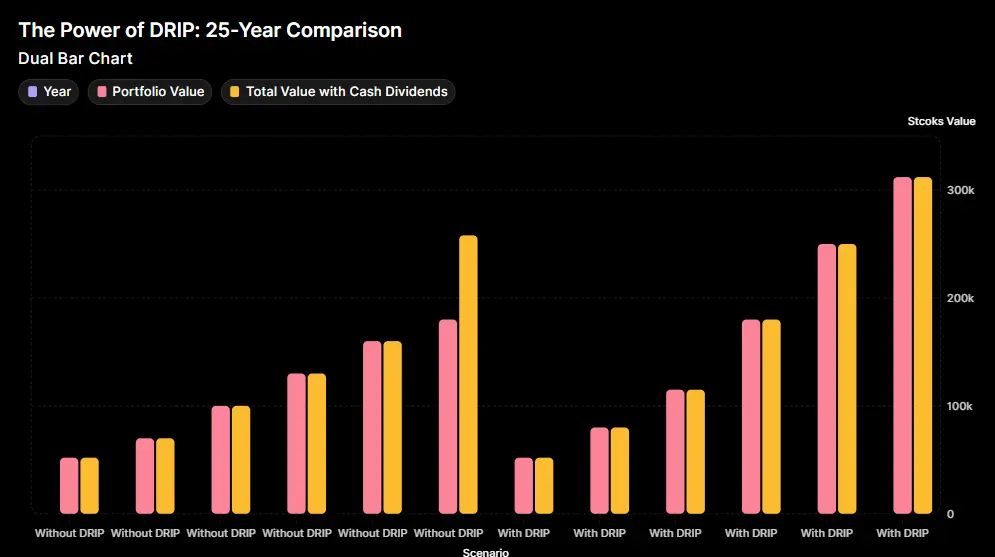
DRIP Impact Over 25 Years ($50,000 Initial Investment):
Without DRIP (Taking Cash):
- Portfolio value: $180,000
- Total dividends received: $78,000 (spent)
- Total wealth: $258,000
With DRIP (Reinvesting):
- Portfolio value: $312,000
- Dividends reinvested: $0 (all bought more shares)
- Total wealth: $312,000
Difference: $54,000 (21% more wealth through DRIP)
Most major brokerages like Fidelity and Vanguard offer free automatic dividend reinvestment plans that you can enable with a simple account setting change.
How to Enable DRIP:
- Most brokers: Settings → DRIP enrollment → Enable for all positions
- Fidelity, Schwab, Vanguard: Free automatic DRIP
- Robinhood: Dividend reinvestment in settings
- ETFs: DRIP available at all major brokers
Use our dividend calculator to model the exact impact of DRIP on your specific aristocrat portfolio over your investment timeline.
Step 4: Dollar-Cost Average Your Entry
Don’t invest your entire aristocrat allocation in one lump sum. Spread purchases over 6-12 months to reduce timing risk.
6-Month Dollar-Cost Averaging Example ($30,000 Total):
- Month 1: Invest $5,000 (16.7%)
- Month 2: Invest $5,000 (33.3% deployed)
- Month 3: Invest $5,000 (50% deployed)
- Month 4: Invest $5,000 (66.7% deployed)
- Month 5: Invest $5,000 (83.3% deployed)
- Month 6: Invest $5,000 (100% deployed)
Benefits:
- Reduces risk of buying at market peak
- Psychologically easier than lump sum
- Captures different price points
- Lowers average cost per share
Accelerate in Market Dips: If aristocrats drop 10%+, accelerate your schedule by investing 2-3 months’ allocation immediately.
Step 5: Rebalance Annually
Once per year, rebalance your aristocrat portfolio to maintain target allocations.
When to Rebalance:
- Stock grows to >10% of portfolio (trim back to 8%)
- Sector exceeds 35% (redistribute to underweighted sectors)
- New capital added (deploy to underweighted positions)
- Company loses aristocrat status (consider selling)
Tax-Efficient Rebalancing:
- In tax-advantaged accounts (IRA, 401k): Rebalance freely no tax consequences
- In taxable accounts: Minimize selling appreciated positions; instead, direct new contributions to underweighted positions
Step 6: Monitor for Aristocrat Status Changes
The aristocrat list changes as companies are added or removed. Stay informed to maintain portfolio quality. Financial news platforms like Seeking Alpha provide real-time dividend announcements and analysis, though it’s important to verify critical information through official company sources before making investment decisions.
Quarterly Monitoring:
- Check for dividend announcements
- Watch for companies approaching 25 years (potential additions)
- Monitor struggling companies (potential removals)
Recent Removals (2020-2024):
- Walgreens (WBA): Removed after cutting dividend in 2024
- Verizon (VZ): Removed after pandemic dividend cut
- Kohl’s (KSS): Removed after dividend reduction
When a Company is Removed:
- Don’t panic sell immediately
- Reassess the company’s fundamentals
- If dividend cut signals deeper problems, exit position
- If temporary setback, may hold if valuation attractive
- Replace with current aristocrat to maintain strategy
Common Dividend Aristocrat Investing Mistakes
Avoid these pitfalls to maximize your aristocrat portfolio’s success.
Mistake #1: Chasing the Highest Yields
The Trap: Buying only the highest-yielding aristocrats (6%+ yields) for maximum current income.
Why It Fails: Exceptionally high yields (6%+) among aristocrats often signal underlying problems. Walgreens’ 6.8% yield preceded its dividend cut. AT&T’s 5.6% yield reflects competitive pressures.
Better Approach: Target a blended yield of 3-4% from a diversified mix of aristocrats. High yields often come with high risk of dividend cuts or capital losses that negate the income advantage.
Example:
- High-Yield Strategy: WBA (6.8%), T (5.6%), MMM (5.8%) = 6.1% average yield
- Balanced Strategy: JNJ (3.0%), PG (2.4%), LOW (1.9%) = 2.4% average yield
After 10 years, the balanced strategy often outperforms due to dividend growth and capital appreciation, even with the lower starting yield.
Mistake #2: Ignoring Valuation
The Trap: Buying aristocrats solely because of their 25+ year streak, regardless of valuation multiples.
Why It Fails: Even quality companies become poor investments at excessive prices. Buying aristocrats at 30-35x earnings during market peaks leads to years of underperformance.
Better Approach: Compare current P/E ratios to historical averages. Wait for pullbacks to buy aristocrats at reasonable valuations.
Valuation Checklist:
- P/E ratio below 25x (below 20x is better)
- Payout ratio under 70%
- Current yield above 5-year average yield
- Price/Sales ratio below 5-year average
Patient Buying: Maintain a watchlist of desired aristocrats and buy during market corrections when valuations improve.
Mistake #3: Over-Concentrating in One Sector
The Trap: Loading up on one sector’s aristocrats because they’re familiar or currently performing well.
Why It Fails: Sector rotation is real. Consumer Staples aristocrats dominated 2008-2015, then underperformed 2016-2021. Industrials crushed it 2021-2023. No sector wins forever.
Better Approach: Diversify across at least 6-8 sectors to smooth returns and reduce volatility.
Sector Allocation Limits:
- No sector >35% of portfolio
- Have at least 5% in 6+ different sectors
- Underweight struggling sectors, don’t eliminate them
Mistake #4: Neglecting Dividend Growth Rate
The Trap: Focusing only on current yield while ignoring the dividend growth rate.
Why It Fails: A 5% yielding stock with 2% annual dividend growth will be outpaced by a 2.5% yielding stock with 10% annual dividend growth within 7-8 years.
Better Approach: Balance current yield with growth potential. Seek aristocrats with 7-10% dividend growth rates for long-term income acceleration.
Dividend Growth Sweet Spot:
- Mature aristocrats (50+ years): 4-6% growth
- Mid-stage aristocrats (30-40 years): 6-8% growth
- Newer aristocrats (25-30 years): 8-12% growth
Mistake #5: Panic Selling During Market Crashes
The Trap: Selling aristocrat positions when they decline 20-30% during bear markets.
Why It Fails: Market crashes are when aristocrats prove their worth through maintained dividends. Selling locks in losses and forfeits the recovery gains.
Better Approach: During crashes, aristocrats typically maintain or raise dividends. Focus on the income stream, not portfolio value fluctuations.
2020 COVID Crash Example: Aristocrats fell -27%, but 65 of 68 maintained or raised dividends through the pandemic. Investors who held recovered within 6 months and enjoyed rising income throughout.
Mistake #6: Forgetting About Taxes
The Trap: Building entire aristocrat portfolio in taxable accounts without considering tax efficiency.
Why It Fails: Qualified dividend tax rates (0%, 15%, 20%) are favourable, but still reduce your effective yield. REIT dividends (Realty Income, Federal Realty) are taxed as ordinary income (up to 37%). Understanding how dividends are taxed is crucial qualified dividends receive favourable tax treatment at capital gains rates (0%, 15%, or 20% depending on income), which you can learn more about in the IRS Tax Topic 404 on dividends, while ordinary dividends are taxed at higher income tax rates.
Better Approach:
- Tax-advantaged accounts (IRA, Roth IRA): Hold REITs and highest-yielding aristocrats
- Taxable accounts: Hold most tax-efficient aristocrats (qualified dividends)
- Roth IRA priority: Put fastest dividend growers in Roth for tax-free compound growth
Tax Example:
- $100K aristocrat portfolio yielding 3% = $3,000 annual dividends
- 15% qualified dividend tax rate = $450 annual taxes
- In Roth IRA: $0 taxes, $450 annual savings
Over 30 years, that $450 annual tax savings compounds to $44,000+ more wealth through tax-free growth.
Mistake #7: Buying Right Before Ex-Dividend Date
The Trap: Buying aristocrats immediately before the ex-dividend date to “capture” the upcoming dividend payment.
Why It Fails: Stock prices typically drop by approximately the dividend amount on the ex-dividend date. You’re not getting “free money” you’re just converting share value to cash, creating an immediate taxable event.
Better Approach: Buy aristocrats based on fundamental value and long-term outlook, not dividend calendar timing. The stock will drop by the dividend amount, negating any benefit.
Example:
- Stock price: $100 before ex-dividend
- Dividend: $1.00
- Ex-dividend date: Stock opens at $99
- Net gain: $0 (before taxes)
- Tax owed: $0.15 (if 15% rate)
- Actual loss: -$0.15
Mistake #8: Assuming All Aristocrats Are Equally Safe
The Trap: Treating all 68 aristocrats as identical just because they share the 25-year designation.
Why It Fails: A 65-year streak (Dover, Procter & Gamble) demonstrates far more resilience than a 25-year streak. Longer streaks have survived more recessions, wars, and disruptions.
Better Approach: Tilt toward aristocrats with 40+ year streaks for maximum safety. These companies have proven they can handle anything.
Aristocrat Tiers by Streak Length:
- Elite (60+ years): Extraordinary resilience – 11 companies
- Veteran (40-59 years): Excellent track record – 23 companies
- Established (25-39 years): Proven but less tested – 34 companies
Core Portfolio: 60-70% from Elite and Veteran tiers, 30-40% from Established tier.
Frequently Asked Questions
What are the top 5 Dividend Aristocrats?
The “top” aristocrats depend on your criteria, but here are the five most popular by different measures:
By Dividend Streak Length:
- Procter & Gamble (PG) – 68 years
- Dover Corp (DOV) – 68 years
- Genuine Parts (GPC) – 68 years
- Emerson Electric (EMR) – 67 years
- 3M Company (MMM) – 65 years
By Market Capitalization:
- Walmart (WMT) – $507 billion
- Johnson & Johnson (JNJ) – $385 billion
- Procter & Gamble (PG) – $378 billion
- PepsiCo (PEP) – $227 billion
- Coca-Cola (KO) – $265 billion
By Dividend Yield:
- Walgreens (WBA) – 6.8%
- 3M Company (MMM) – 5.8%
- AT&T (T) – 5.6%
- Realty Income (O) – 5.3%
- T. Rowe Price (TROW) – 4.5%
By Dividend Growth (5-Year Average):
- AbbVie (ABBV) – 14.2% annual
- Lowe’s (LOW) – 12.8% annual
- Target (TGT) – 11.5% annual
- McDonald’s (MCD) – 10.2% annual
- S&P Global (SPGI) – 9.8% annual
For a balanced portfolio, choose aristocrats across all these categories rather than focusing solely on one metric.
How many Dividend Aristocrats are there?
There are currently 68 Dividend Aristocrats in 2025. This number fluctuates annually as companies are added (reaching 25 years of increases) or removed (dividend cuts or S&P 500 removal).
Historical Count:
- 2020: 66 aristocrats
- 2021: 65 aristocrats (COVID dividend cuts)
- 2022: 64 aristocrats
- 2023: 67 aristocrats
- 2024-2025: 68 aristocrats
Notable Recent Changes:
- Added (2023-2024): Several companies reached their 25-year milestone
- Removed (2023-2024): Walgreens, Verizon cut dividends and lost status
The aristocrat designation is rigorous companies must maintain S&P 500 membership AND increase dividends every single year. A single frozen dividend (even without a cut) ends the streak.
Are Dividend Aristocrats a good investment?
Yes, Dividend Aristocrats are excellent investments for most long-term investors, particularly those seeking income and lower volatility. Here’s why:
Historical Evidence:
- 20-year annualized return: 11.2% vs. 9.8% for S&P 500
- Lower volatility: 15-20% less price fluctuation than broad market
- Bear market protection: Declined 30-40% less than S&P 500 in 2008, 2020, 2022
- Income reliability: 95%+ maintained or raised dividends through COVID-19
Best For:
- Retirees: Reliable, growing income stream
- Conservative investors: Lower volatility reduces anxiety
- Long-term accumulators: Compound growth through reinvestment
- Inflation hedge: 6-7% annual dividend growth outpaces inflation
Not Ideal For:
- Growth maximizers: Tech stocks and small-caps offer higher growth potential
- Short-term traders: Aristocrats are slow, steady performers
- Those needing immediate high income: Average 2.8% yield may seem low
Bottom Line: Aristocrats sacrifice some upside potential in bull markets for significant downside protection in bears. Over complete market cycles, they outperform while providing rising income a powerful combination for most investors.
What are the dividend kings?
Dividend Kings are the ultra-elite: companies that have increased dividends for 50+ consecutive years (vs. 25+ for aristocrats). There are currently 53 Dividend Kings, including:
Notable Dividend Kings:
- American States Water (AWR) – 71 years
- Dover Corporation (DOV) – 68 years
- Genuine Parts Company (GPC) – 68 years
- Procter & Gamble (PG) – 68 years
- Emerson Electric (EMR) – 67 years
- 3M Company (MMM) – 65 years
- Cincinnati Financial (CINF) – 63 years
- Johnson & Johnson (JNJ) – 62 years
- Coca-Cola (KO) – 62 years
- Colgate-Palmolive (CL) – 61 years
Key Differences from Aristocrats:
- No size requirement: Kings can be any market cap
- No index requirement: Don’t need S&P 500 membership
- More exclusive: Only 53 vs. 68 aristocrats
- Many overlap: 30+ companies are both Kings and Aristocrats
Advantage of Kings: A 50+ year streak demonstrates extraordinary resilience through more recessions, wars, and market cycles than 25-year streaks.
Investing in Kings: Focus on those that are also aristocrats for liquidity and analyst coverage. Smaller Kings (mid-caps, small-caps) require more research but may offer better value.
How much do I need to invest to get $3,000 a month in dividends?
To generate $3,000 monthly ($36,000 annually) in dividends from Dividend Aristocrats:
At 2.8% Average Yield (Current Aristocrat Average):
- Investment needed: $1,285,714
- Monthly income: $3,000
At 3.5% Blended Yield (Tilt Toward Higher-Yielders):
- Investment needed: $1,028,571
- Monthly income: $3,000
At 4.5% High-Yield Strategy (Riskier, Focus on REITs + Challenged Aristocrats):
- Investment needed: $800,000
- Monthly income: $3,000
Building to $3,000 Monthly: Realistic Timeline
Starting from $0 with monthly contributions:
Scenario 1: Aggressive Accumulation
- Monthly investment: $2,000
- Average return: 10% (including dividend reinvestment)
- Time to $36,000 annual income: 22 years
Scenario 2: Moderate Accumulation
- Monthly investment: $1,000
- Average return: 10%
- Time to $36,000 annual income: 29 years
Scenario 3: Supplemented by Inheritance/Windfall
- Starting lump sum: $500,000
- Monthly investment: $500
- Average return: 10%
- Time to $36,000 annual income: 12 years
Key Insight: Most investors reach meaningful dividend income through decades of consistent reinvestment, not immediate high yields. A $50,000 portfolio today yielding 3% generates only $1,500 annually but with 7% dividend growth, that income doubles every 10 years without adding capital.
Use our schd dividend calculator to model your personal path to $3,000 monthly income based on your starting capital, contribution schedule, and expected returns.
Is Johnson & Johnson a Dividend Aristocrat?
Yes, Johnson & Johnson (JNJ) is one of the most prestigious Dividend Aristocrats with a 62-year consecutive dividend increase streak. JNJ is also a Dividend King (50+ years).
JNJ Dividend Profile:
- Current Yield: 3.0%
- Dividend Growth Streak: 62 years
- 5-Year Dividend Growth: 5.8% annually
- Payout Ratio: 45% (very safe)
- Market Cap: $385 billion
Why JNJ is a Top Aristocrat:
- Diversified across pharmaceuticals, medical devices, consumer health
- Consistent cash flow from essential healthcare products
- Global presence in 60+ countries
- AAA credit rating (one of only two U.S. companies)
- Raised dividends through COVID-19 without hesitation
Recent Change: JNJ spun off consumer health division (Kenvue) in 2023 but maintained its aristocrat streak through the split.
Investment Consideration: JNJ is a core holding for many aristocrat portfolios due to its healthcare exposure, elite dividend history, and defensive characteristics. The 3.0% yield combined with 5-8% annual growth provides an attractive total return profile.
Investors can track JNJ’s dividend announcements and financial performance directly through the company’s official investor relations page, which provides quarterly earnings reports and dividend declaration dates.
Do dividend aristocrats outperform the S&P 500?
Yes, historically Dividend Aristocrats have outperformed the S&P 500 by approximately 1.0-1.5% annually over long periods, though performance varies by timeframe.
Long-Term Performance (20+ Years):
- Aristocrats: 11.2% annual return
- S&P 500: 9.8% annual return
- Outperformance: +1.4% annually
Where Aristocrats Win:
- Bear Markets: Significantly outperform during declines (2008, 2020, 2022)
- Flat Markets: Dividend income provides positive returns when prices stagnate
- Volatility Reduction: 15-20% lower standard deviation
Where Aristocrats Lag:
- Tech-Driven Bull Markets: Underperformed 1995-2000 and 2017-2021
- Explosive Growth Periods: Can’t match hypergrowth sectors
Total Return Breakdown:
- Capital Appreciation: S&P 500 slightly higher
- Dividend Income: Aristocrats significantly higher (2.8% vs. 1.4%)
- Combined: Aristocrats win due to income advantage
Tax Considerations: In taxable accounts, aristocrats’ qualified dividends are taxed annually, while S&P 500 growth stocks defer taxes until sold, providing a slight tax efficiency advantage to the S&P 500.
Bottom Line: Over complete market cycles including both bulls and bears, aristocrats outperform due to lower drawdowns and consistent income, though they sacrifice some upside in euphoric bull markets.
Is McDonald’s a Dividend Aristocrat?
Yes, McDonald’s (MCD) is a Dividend Aristocrat with a 48-year consecutive dividend increase streak.
MCD Dividend Profile:
- Current Yield: 2.3%
- Dividend Growth Streak: 48 years
- 5-Year Dividend Growth: 8.1% annually
- Payout Ratio: 58%
- Market Cap: $205 billion
Why MCD is a Strong Aristocrat:
- Global brand with 40,000+ locations worldwide
- Franchise model generates stable royalty income
- Recession-resistant: Fast food demand remains stable in downturns
- Real estate ownership adds asset value
- Digital transformation driving growth
Investment Highlight: MCD combines a respectable 2.3% yield with strong 8% dividend growth, making it attractive for long-term total return. The business model’s predictability and global diversification provide stability.
Sector Representation: MCD is one of only five consumer discretionary aristocrats, demonstrating exceptional resilience for a sector typically vulnerable to economic cycles.
Is Lowe’s a Dividend Aristocrat?
Yes, Lowe’s Companies (LOW) is a Dividend Aristocrat with a 61-year consecutive dividend increase streak.
LOW Dividend Profile:
- Current Yield: 1.9%
- Dividend Growth Streak: 61 years
- 5-Year Dividend Growth: 12.8% annually
- Payout Ratio: 35%
- Market Cap: $125 billion
Why LOW is an Attractive Aristocrat:
- Home improvement spending remains resilient through cycles
- DIY and professional contractor customer base
- Low payout ratio (35%) allows aggressive dividend growth
- Store optimization and e-commerce growth
- Aging housing stock drives repair/remodel demand
Investment Highlight: LOW’s combination of a 61-year streak with 12.8% recent dividend growth makes it one of the fastest-growing aristocrat dividends. The below-average 1.9% current yield is offset by exceptional growth potential.
Versus Home Depot: While Home Depot (HD) is larger, it’s not an aristocrat (only 15 years of increases). LOW’s 61-year streak demonstrates superior long-term consistency.
Is Walmart a dividend king?
Yes, Walmart (WMT) is both a Dividend Aristocrat (51-year streak) and a Dividend King (50+ years).
WMT Dividend Profile:
- Current Yield: 1.5%
- Dividend Growth Streak: 51 years
- 5-Year Dividend Growth: 9.2% annually
- Payout Ratio: 38%
- Market Cap: $507 billion
Why WMT is a Top-Tier Dividend Stock:
- Largest retailer in the world with scale advantages
- Essential goods focus ensures recession resistance
- E-commerce transformation competing with Amazon
- International presence in 24 countries
- Low payout ratio allows continued aggressive dividend growth
Investment Consideration: WMT’s modest 1.5% yield is compensated by 9% dividend growth and exceptional business quality. As the world’s largest retailer, it provides unmatched scale and stability.
Recent Acceleration: WMT’s dividend growth has accelerated from 5-6% (2010s) to 9-10% (2020s) as profitability improved from e-commerce and membership programs.
What is the highest yielding dividend aristocrat?
Walgreens Boots Alliance (WBA) currently offers the highest yield at 6.8%, but this comes with significant risk.
Highest-Yielding Aristocrats (2025):
- Walgreens (WBA) – 6.8% [Warning: High risk]
- 3M Company (MMM) – 5.8%
- AT&T (T) – 5.6%
- Realty Income (O) – 5.3%
- T. Rowe Price (TROW) – 4.5%
High Yield Warning: WBA’s 6.8% yield reflects serious business challenges:
- Declining retail foot traffic
- Amazon Pharmacy competition
- Pressure on pharmacy margins
- Store closures announced
- Dividend cut risk elevated
Safer High-Yield Options:
- Realty Income (O) – 5.3% with monthly payments and REIT stability
- T. Rowe Price (TROW) – 4.5% with 37-year streak despite asset management headwinds
- Federal Realty (FRT) – 4.1% with 56-year streak and premium retail properties
Yield vs. Safety Trade-Off: A sustainable 4-5% yield from a quality aristocrat often outperforms a 6-7% yield from a struggling business that eventually cuts the dividend and suffers capital losses.
How can I make $1,000 a month in dividends?
To generate $1,000 monthly ($12,000 annually) from Dividend Aristocrats:
Investment Required by Yield:
- At 2.8% yield: $428,571 invested
- At 3.5% yield: $342,857 invested
- At 4.5% yield: $266,667 invested
Realistic Path to $1,000 Monthly
Scenario 1: Starting from Zero with $500 Monthly Investments
- Monthly contribution: $500
- Average return: 10% (with DRIP)
- Time to $1,000 monthly income: 18-20 years
Scenario 2: Starting with $50,000 + $300 Monthly
- Initial investment: $50,000
- Monthly contribution: $300
- Average return: 10%
- Time to $1,000 monthly income: 12-14 years
Scenario 3: Lump Sum Investment of $150,000
- Initial investment: $150,000
- No additional contributions
- Average return: 10% (with DRIP)
- Time to $1,000 monthly income: 10-12 years
Dividend Growth Acceleration: Even without adding capital, dividend growth compounds income:
- Year 1: $150,000 at 3% yield = $4,500 annual ($375/month)
- Year 10: With 7% dividend growth = $8,800 annual ($733/month)
- Year 15: $12,300 annual ($1,025/month) – Goal reached!
Key Strategies:
- Enable DRIP to compound shares
- Reinvest all dividends for 15-20 years
- Add monthly contributions when possible
- Focus on dividend growth, not just current yield
- Stay disciplined through market volatility
Model your exact path using our schd dividend calculator with your specific starting capital and contribution schedule.
Take Action: Your Dividend Aristocrat Investment Checklist
Ready to build your Dividend Aristocrat portfolio? Follow this 30-day action plan:
Week 1: Education & Planning
- ☑︎ Read this complete aristocrats guide
- ☑︎ Determine your aristocrat allocation (% of portfolio)
- ☑︎ Decide: Individual stocks, ETF, or hybrid approach
- ☑︎ Set income goals (target monthly dividends)
- ☑︎ Choose brokerage account (if needed)
Week 2: Research & Selection
- ☑︎ Review complete 68-stock aristocrat list above
- ☑︎ Identify 15-20 aristocrats matching your criteria
- ☑︎ Check valuations (P/E ratios, yields vs. historical averages)
- ☑︎ Ensure sector diversification (8+ sectors)
- ☑︎ Use dividend calculator to model your specific scenario
Week 3: Account Setup & Initial Investment
- ☑︎ Open brokerage account (or use existing)
- ☑︎ Fund account with initial investment capital
- ☑︎ Enable DRIP (dividend reinvestment)
- ☑︎ Make first purchases (3-5 aristocrats or NOBL ETF)
- ☑︎ Set up automatic monthly contributions
Week 4: Portfolio Management Systems
- ☑︎ Create tracking spreadsheet (portfolio allocation, yield, cost basis)
- ☑︎Set calendar reminders for quarterly reviews
- ☑︎ Subscribe to dividend announcement alerts
- ☑︎ Connect with other dividend investors through communities like Reddit’s r/dividends to share strategies, discuss individual aristocrats, and stay informed about market trends, though always verify information independently.
- ☑︎ Schedule annual rebalancing
Ongoing Monthly Actions:
- ☑︎ Add new capital from savings
- ☑︎ Review aristocrat list for changes
- ☑︎ Dollar-cost average new positions
- ☑︎ Monitor dividend announcements
- ☑︎ Reinvest dividends automatically
Quarterly Reviews:
- ☑︎ Check for aristocrat additions/removals
- ☑︎ Review portfolio sector allocation
- ☑︎ Assess dividend growth rates
- ☑︎ Rebalance if any position exceeds 10%
- ☑︎ Celebrate dividend income received!
Conclusion: Building Wealth with Dividend Aristocrats
By investing alongside these proven winners, you’re not just buying stocks you’re acquiring ownership in businesses that have demonstrated their ability to generate and grow cash flows through every economic environment imaginable.
The path to financial independence through dividend investing isn’t about getting rich overnight. It’s about the disciplined accumulation of quality companies, the patient reinvestment of dividends, and the power of compound growth working in your favor over decades.
Remember These Core Principles:
- Quality Over Yield: A sustainable 3% yield that grows 8% annually will outperform a risky 6% yield that eventually gets cut.
- Diversification Matters: Spread across 15-25 individual aristocrats or use ETFs to ensure no single company failure derails your income.
- Reinvest Early, Spend Later: DRIP your dividends for 15-20 years to build a massive income-generating machine, then switch to cash payments when you need the income.
- Stay the Course: The aristocrats that seem boring during bull markets prove their worth during bears. Don’t abandon your strategy during euphoric highs or terrifying lows.
- Time Is Your Ally: A 25-year-old investing $500 monthly in aristocrats can potentially retire with $50,000+ in annual dividend income by age 60 without ever selling a share.
The Dividend Aristocrats have already proven themselves through 25+ years of increases. Now it’s your turn to prove your discipline as an investor. Start small if necessary, add consistently, reinvest religiously, and let the mathematics of compound growth work their magic.
Your financial future doesn’t depend on picking the next Tesla or timing the perfect market entry. It depends on owning great businesses that pay you increasing dividends year after year after year regardless of what the market does.
The 68 Dividend Aristocrats are ready to work for you. The only question is: are you ready to let them?
Start building your aristocrat portfolio today using our schd dividend calculator to map your personal path to financial freedom through dividend investing.